PERFORMANCE INTELLIGENCE
Uncover what standard reports can't — and know what to optimize next
Cross-filter campaigns, segments, metrics, time, and profitability to reveal patterns that are hard to see in standard ad platforms. Find what's working, where efficiency breaks down, and where to focus optimization.
No credit card required
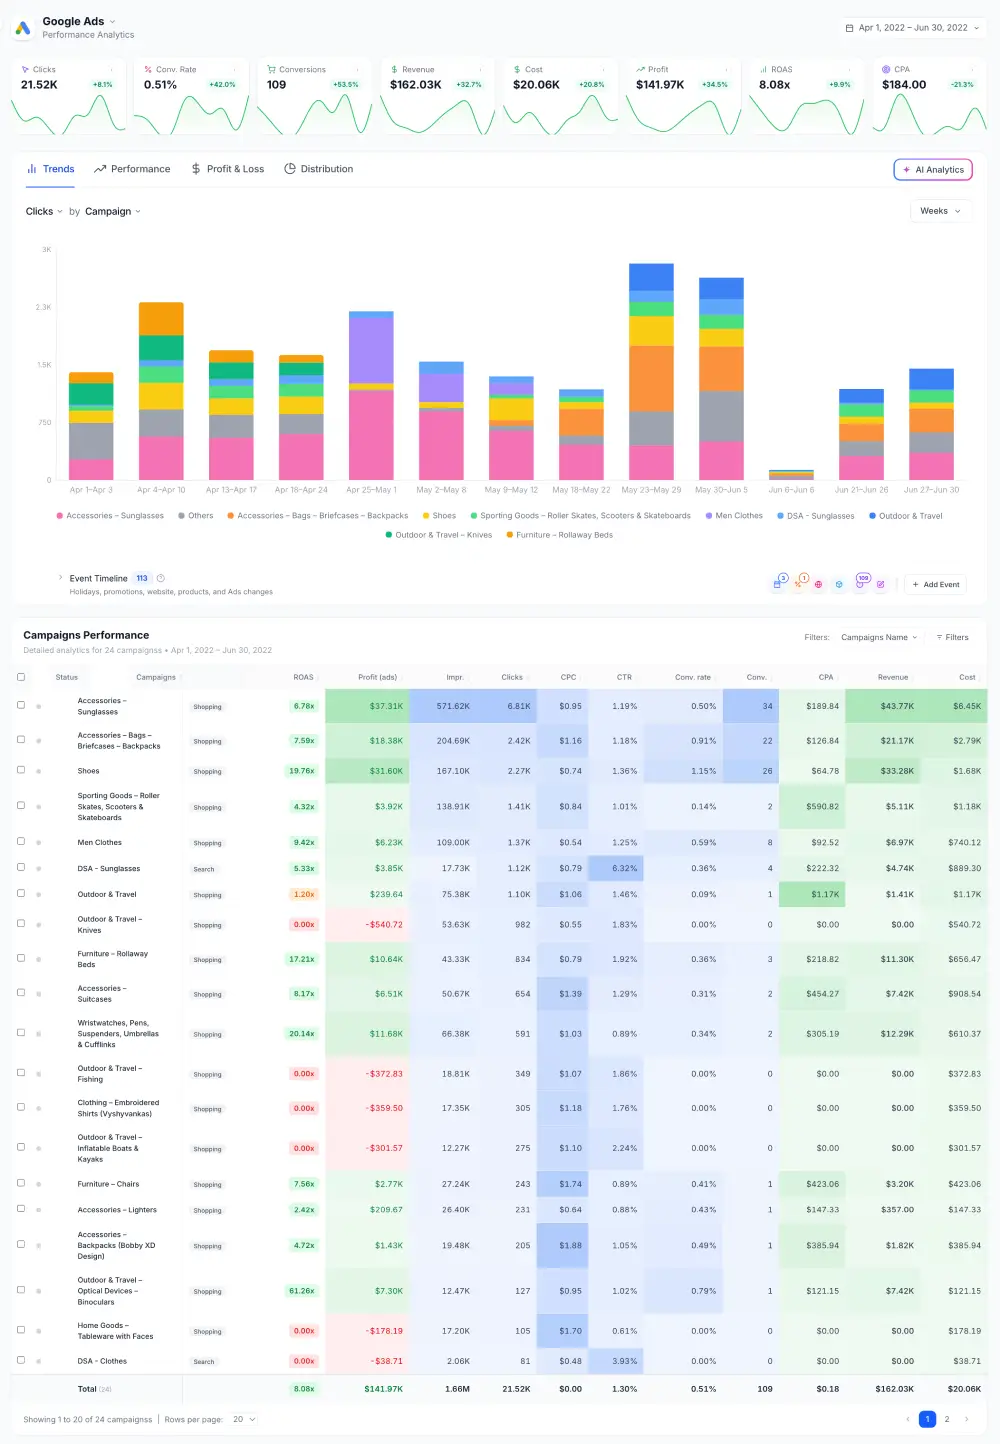
Choose a platform, then cross-filter its own metrics and dimensions without losing context.
 Google Ads
 Meta Ads
 Microsoft Ads
 TikTok Ads
 LinkedIn Ads
 Google Analytics 4
 Shopify
 Amazon
(With more integrations coming soon)
SMART DASHBOARDS
Turn disconnected platform views into one connected dashboard
Turn dozens of disconnected platform views into one connected dashboard. Cross-filter across metrics, campaigns, segments, and time to uncover insights you can't see in individual platforms.

PERFORMANCE
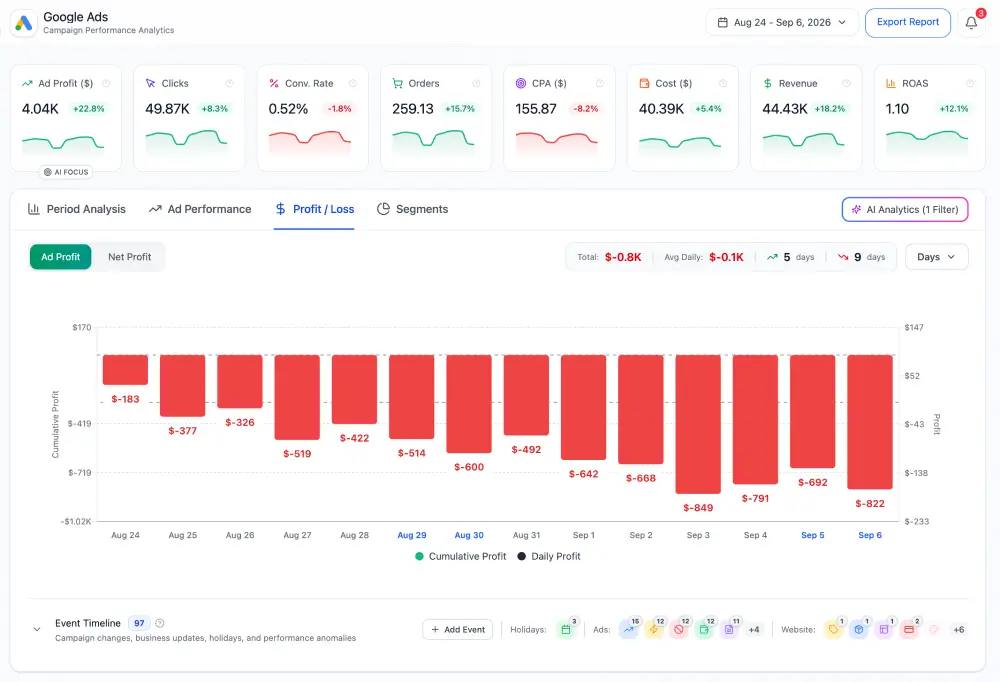
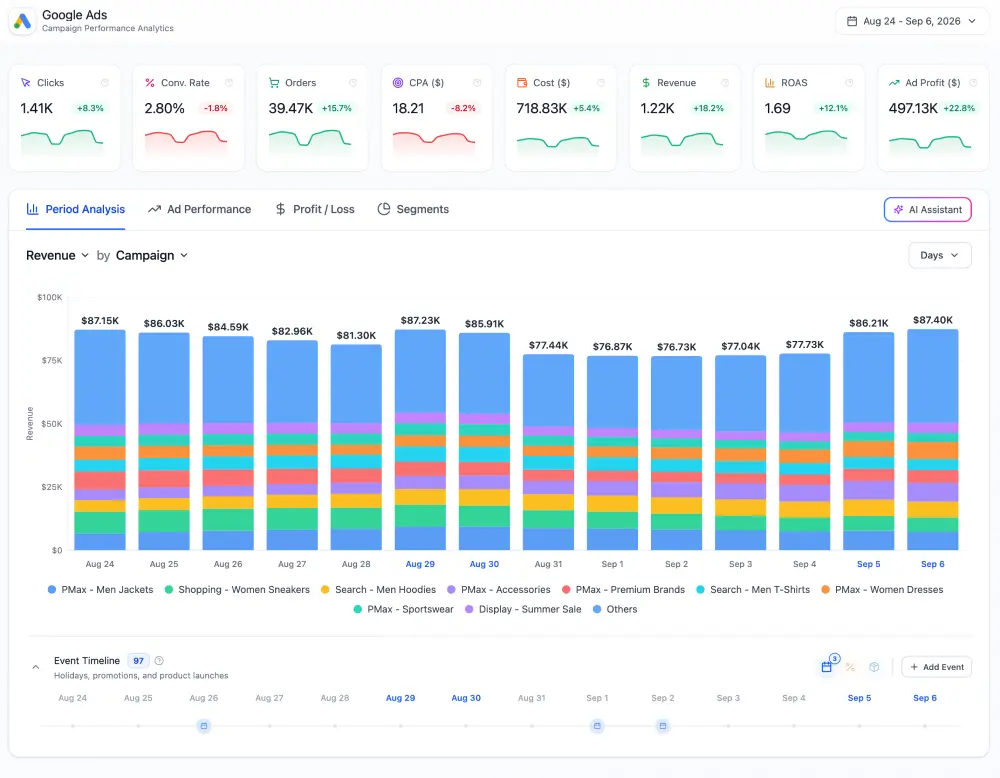
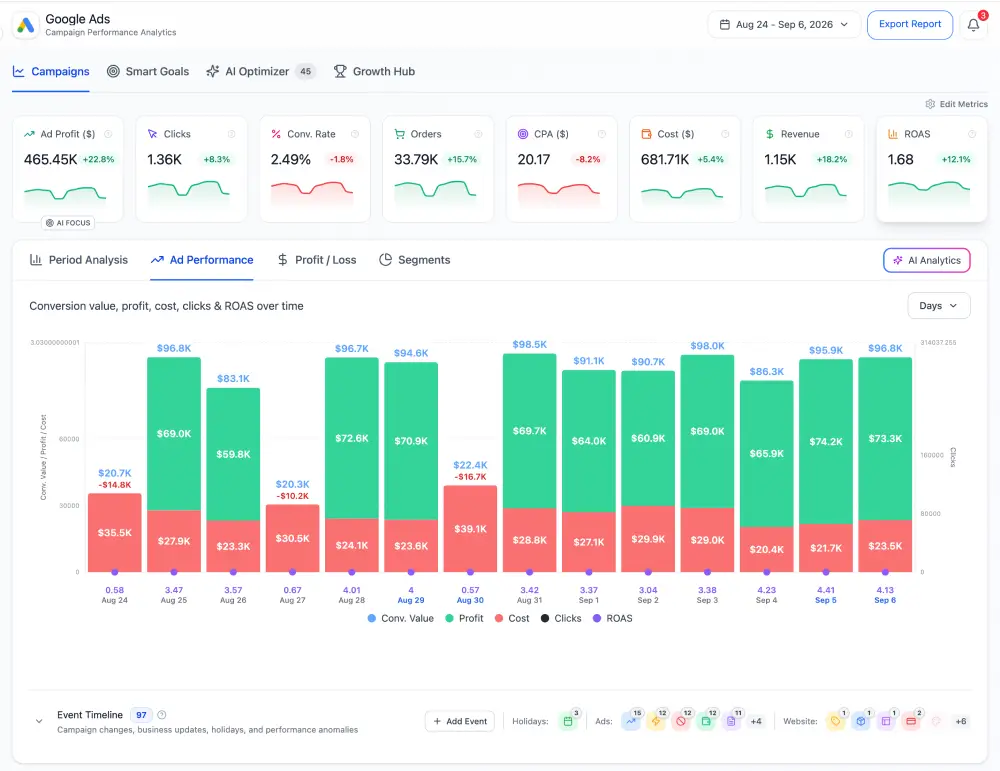
See revenue, cost, profit, and trends in context
See revenue, cost, profit, conversions, clicks, and performance trends for any selected campaign, segment, or dimension. Track gains and losses over time to see exactly what drives results.
AI INSIGHTS
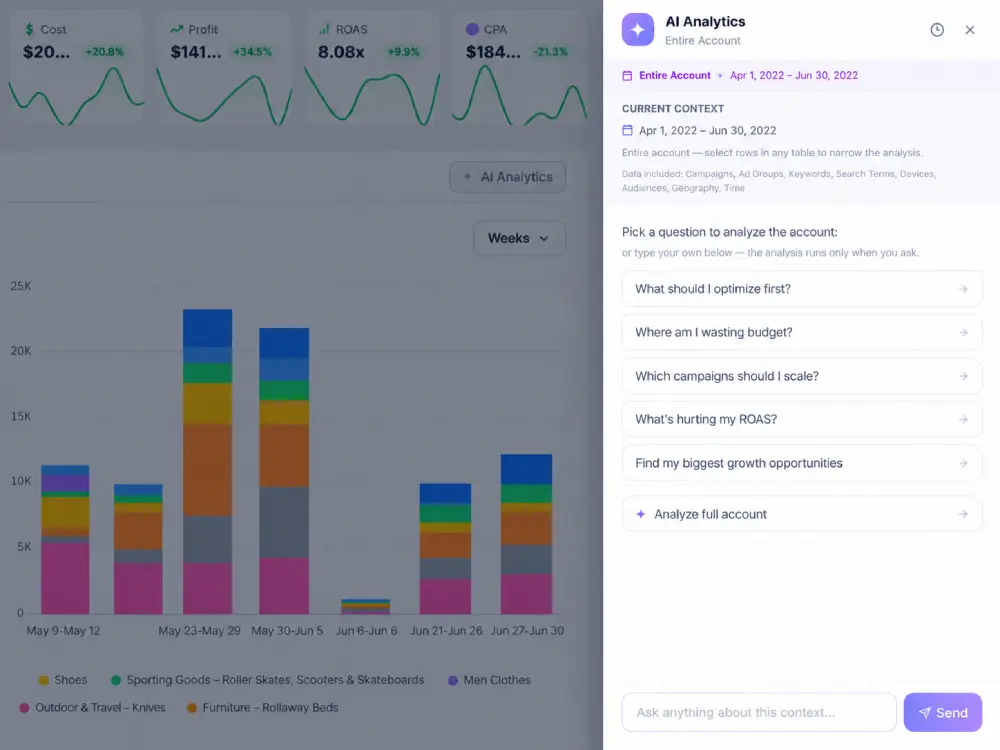
Ask AI about your performance and get answers in context
Ask DataRocks AI questions about your performance and get contextual answers based on your current data selection. Understand what changed, why it matters, and what to do next.
WHY PERFORMANCE INTELLIGENCE
From isolated reports to connected analysis
See the value before you dive into the details: replace fragmented reports and repeated filtering with one connected performance story.
TRADITIONAL REPORTING
×Separate reports
×Repeated filtering
×Context gets lost
×Manual root-cause analysis
×Metrics viewed in isolation
PERFORMANCE INTELLIGENCE
One connected workspace
Cross-filter every view
Preserve analytical context
Move from overview to root cause
Connect performance with profitability
Don't just open another report. Explore the entire performance story in one place.
CROSS-FILTERING
Every selection changes the whole picture
Select a campaign, device, search term, time period, or any combination of segments — and every connected view updates to reflect that exact context.
Ask a more specific question without starting the analysis over.
PERFORMANCE OVER TIME
See when performance changes — and what happened around it
Analyze performance by day, week, or month to uncover trends, growth periods, declines, and seasonality across campaigns and segments.
Connect performance changes with the events happening around them.
PERFORMANCE ECONOMICS
See what revenue actually costs — and what profit remains
Understand not only how much a campaign generated, but how efficiently that result was produced.
Move beyond revenue and understand the economics behind performance.
PROFIT / LOSS
Know exactly when profit turns into loss
Track cumulative and period-by-period profit to see the overall trajectory, identify loss-making periods, measure consistency, and understand when recovery begins.
DEEPER ANALYSIS
Go from the headline result to the exact driver behind it
Start with campaign performance, then drill deeper across the dimensions that explain why the result happened.
Move from “performance changed” to “this is where the change came from.”
SEGMENTS
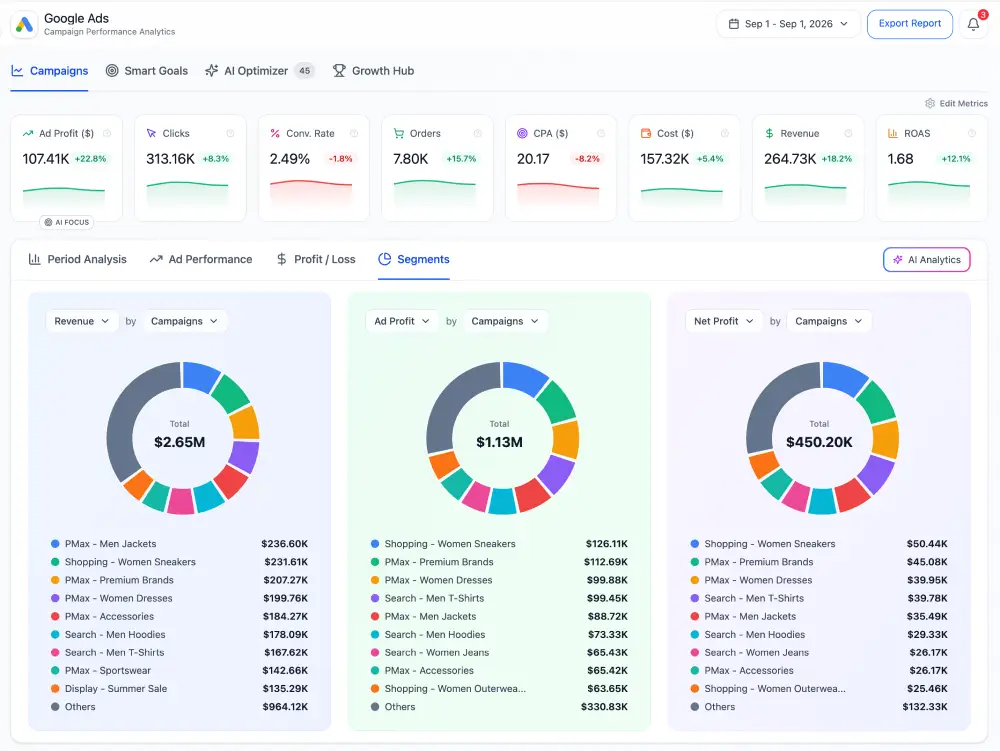
See where performance is concentrated
Compare dimensions to understand which segments contribute the most, where results are concentrated, and where opportunities or risks may be hiding.
AI CAMPAIGN ASSISTANT
Ask your performance data directly
Use AI to explore campaign performance, understand changes, identify anomalies, and uncover optimization opportunities without manually working through every report.
Why did profit fall last week?
Which campaigns are driving the increase in cost?
What segments are hurting ROAS?
From isolated reports to connected analysis
TRADITIONAL REPORTING
×Separate reports
×Repeated filtering
×Context gets lost
×Manual root-cause analysis
×Metrics viewed in isolation
PERFORMANCE INTELLIGENCE
One connected workspace
Cross-filter every view
Preserve analytical context
Move from overview to root cause
Connect performance with profitability
Don’t just open another report. Explore the entire performance story in one place.
Spend less time building reports. Spend more time understanding performance.
SEE THE FULL PICTURE
Understand performance across campaigns, segments, metrics, and profitability.
FIND ROOT CAUSES FASTER
Move from an account-level change to the dimensions behind it.
SPOT INEFFICIENCIES
Identify segments, periods, and combinations that waste spend or reduce profit.
MAKE FASTER DECISIONS
Keep the same context as you move from analysis to optimization.
MOBILE PERFORMANCE INTELLIGENCE
Deep analysis, wherever the decision happens
On mobile, every row still carries the business story. Compare ROAS, profit, impressions, cost, and conversion performance without waiting for a desktop report.
- Drill from account to campaign, ad, search term, device, network, and time.
- Read positive and negative performance instantly through heatmapped metrics.
- Keep filters, totals, pagination, Event Timeline, and AI insights in reach.
Questions, answered.
What is Performance Intelligence?
Performance Intelligence is a connected workspace for analyzing advertising performance. It brings campaigns, metrics, segments, profitability, and AI analysis together so you can move from the big picture to the root cause without rebuilding reports or losing context.
What can I analyze with Performance Intelligence?
Analyze performance across campaigns, ad groups, ads, search terms, devices, networks, time, geography, and other dimensions. Track metrics such as revenue, cost, profit, ROAS, conversions, CPA, and more in the same analytical context.
How is this different from standard advertising reports?
Traditional platforms split analysis across separate reports and tabs. Performance Intelligence connects charts, tables, metrics, and dimensions in one workspace, so you can explore performance without repeatedly rebuilding filters or switching between reports.
What is cross-filtering?
Cross-filtering lets you select a campaign, device, search term, time period, or multiple segments and instantly update the connected charts, metrics, and tables around that selection. It helps you investigate specific questions without starting your analysis over.
Can I see what is actually driving profit or loss?
Yes. Performance Intelligence connects revenue, cost, Ad Profit, ROAS, and Profit / Loss views so you can identify profitable periods, loss-making periods, inefficient segments, and the areas contributing most to the result.
Can I analyze multiple campaigns or segments together?
Yes. You can select individual items or build combinations of campaigns and segments to analyze their combined performance. This makes it easier to compare groups, isolate specific conditions, and investigate complex performance patterns.
How does AI help with performance analysis?
AI can help explain performance changes, analyze trends, identify anomalies, and surface optimization opportunities. You can also ask questions about your data in context instead of manually working through every report.
Does Performance Intelligence automatically change my campaigns?
No. Performance Intelligence helps you analyze performance and identify opportunities, but it does not automatically change your campaigns. You stay in control of what gets implemented.
FAQ
Questions, answered.
What is Performance Intelligence?
Performance Intelligence is a connected workspace for analyzing advertising performance. It brings campaigns, metrics, segments, profitability, and AI analysis together so you can move from the big picture to the root cause without rebuilding reports or losing context.
What can I analyze with Performance Intelligence?
Analyze performance across campaigns, ad groups, ads, search terms, devices, networks, time, geography, and other dimensions. Track metrics such as revenue, cost, profit, ROAS, conversions, CPA, and more in the same analytical context.
How is this different from standard advertising reports?
Traditional platforms split analysis across separate reports and tabs. Performance Intelligence connects charts, tables, metrics, and dimensions in one workspace, so you can explore performance without repeatedly rebuilding filters or switching between reports.
What is cross-filtering?
Cross-filtering lets you select a campaign, device, search term, time period, or multiple segments and instantly update the connected charts, metrics, and tables around that selection. It helps you investigate specific questions without starting your analysis over.
Can I see what is actually driving profit or loss?
Yes. Performance Intelligence connects revenue, cost, Ad Profit, ROAS, and Profit / Loss views so you can identify profitable periods, loss-making periods, inefficient segments, and the areas contributing most to the result.
Can I analyze multiple campaigns or segments together?
Yes. You can select individual items or build combinations of campaigns and segments to analyze their combined performance. This makes it easier to compare groups, isolate specific conditions, and investigate complex performance patterns.
How does AI help with performance analysis?
AI can help explain performance changes, analyze trends, identify anomalies, and surface optimization opportunities. You can also ask questions about your data in context instead of manually working through every report.
Does Performance Intelligence automatically change my campaigns?
No. Performance Intelligence helps you analyze performance and identify opportunities, but it does not automatically change your campaigns. You stay in control of what gets implemented.